Why a logging system?
To understand why we need a logging system/pipeline, we need to understand current solutions—namely, writing to files.
Writing to files isn’t inherently a bad solution; it is durable in nature (if done right) and easy to manage using logrotate or similar utilities. Where it falls short is in processing those (mostly unstructured) logs. Hence, we need an engine to process these logs, along with a reliable and durable way for the logs to reach that engine. for example, to capture access logs from secure software.
What is ClickHouse?
In their own words:
ClickHouse® is a high-performance, column-oriented SQL database management system (DBMS) for online analytical processing (OLAP).
In short, it’s a database for logs and similar data packed with neat features, such as ultra-fast queries and support for JSON objects in a columnar format.
What matters most to us is ClickHouse’s (often abbreviated as CH) capability to support rapid bulk ingestion and flexibility in the data it stores (essentially JSON).
Send Data to CH?
Now that we have a database for our logs, we need a way to send them there. However, we face two main issues:
- Logs are stored in files.
- They are unstructured.
Both problems could be solved by writing a custom program that uses regex or a similar mechanism to parse strings and push them to ClickHouse. While that works, it increases the overall complexity of our system. Since this isn’t a new problem, a well-established solution already exists: vector.dev.
Vector.dev
Vector is an open-source, high-performance telemetry router built in Rust. It serves as the connective tissue in observability architectures, designed to collect, transform, and route logs, metrics, and traces from various sources to any storage backend.
Vector generally works in three main parts:
- Sources: Where data enters (e.g., local log files, syslog, Kafka, or Kubernetes).
- Transforms: Where data is processed (e.g., parsing unstructured text using regular expressions or Vector Remap Language [VRL], filtering noise, or enriching payloads).
- Sinks: Where processed data is delivered (e.g., ClickHouse, Elasticsearch, Grafana Loki, or S3).
Because it is written in Rust, Vector delivers memory safety, extremely high throughput, and low resource overhead—making it ideal for deploying either as a lightweight agent on individual host machines or as a centralized aggregator service.
Vector as an aggregator
One very special thing about Vector is its versatility. As a matter of fact, it can be used as an aggregator for multiple Vector instances (so-called agents).
Since Vector supports itself as a valid sink and source, we can use it to manipulate data such as adding the hostname from which the data originates or use it for buffering data.
Logchef: The Visualizer
Having a high-performance database like ClickHouse and a reliable pipeline like Vector solves the storage and processing problems. However, raw ClickHouse tables aren’t built for human scrambling during an incident. Writing raw SQL queries every time you need to search logs or debug an issue isn’t something anyone wants to do (at least I don’t).
This is where Logchef comes into play.
Logchef is an open-source, single-binary log analytics UI built specifically as a query and control plane on top of ClickHouse. Instead of requiring its own proprietary storage engine, it sits directly on top of your existing ClickHouse log tables.
Key features that complete our logging stack:
- Schema-Agnostic Exploration: Simply point Logchef to any ClickHouse table with a timestamp column, and it automatically detects the schema for instant querying.
- LogchefQL & Raw SQL: Search logs using an intuitive search syntax (
LogchefQL) that automatically compiles down to type-aware ClickHouse SQL, or switch to raw SQL for complex analytical aggregations. - Live Tailing & Dashboards: Watch log streams in real-time as incidents unfold, create operational dashboards, and set up alerts without standing up a separate stack.
With Vector routing the data, ClickHouse handling high-speed columnar storage, and Logchef providing a lightweight UI, we get a completely durable, cost-effective, and open-source logging setup.
So, joining them all together, we get…
Architecture
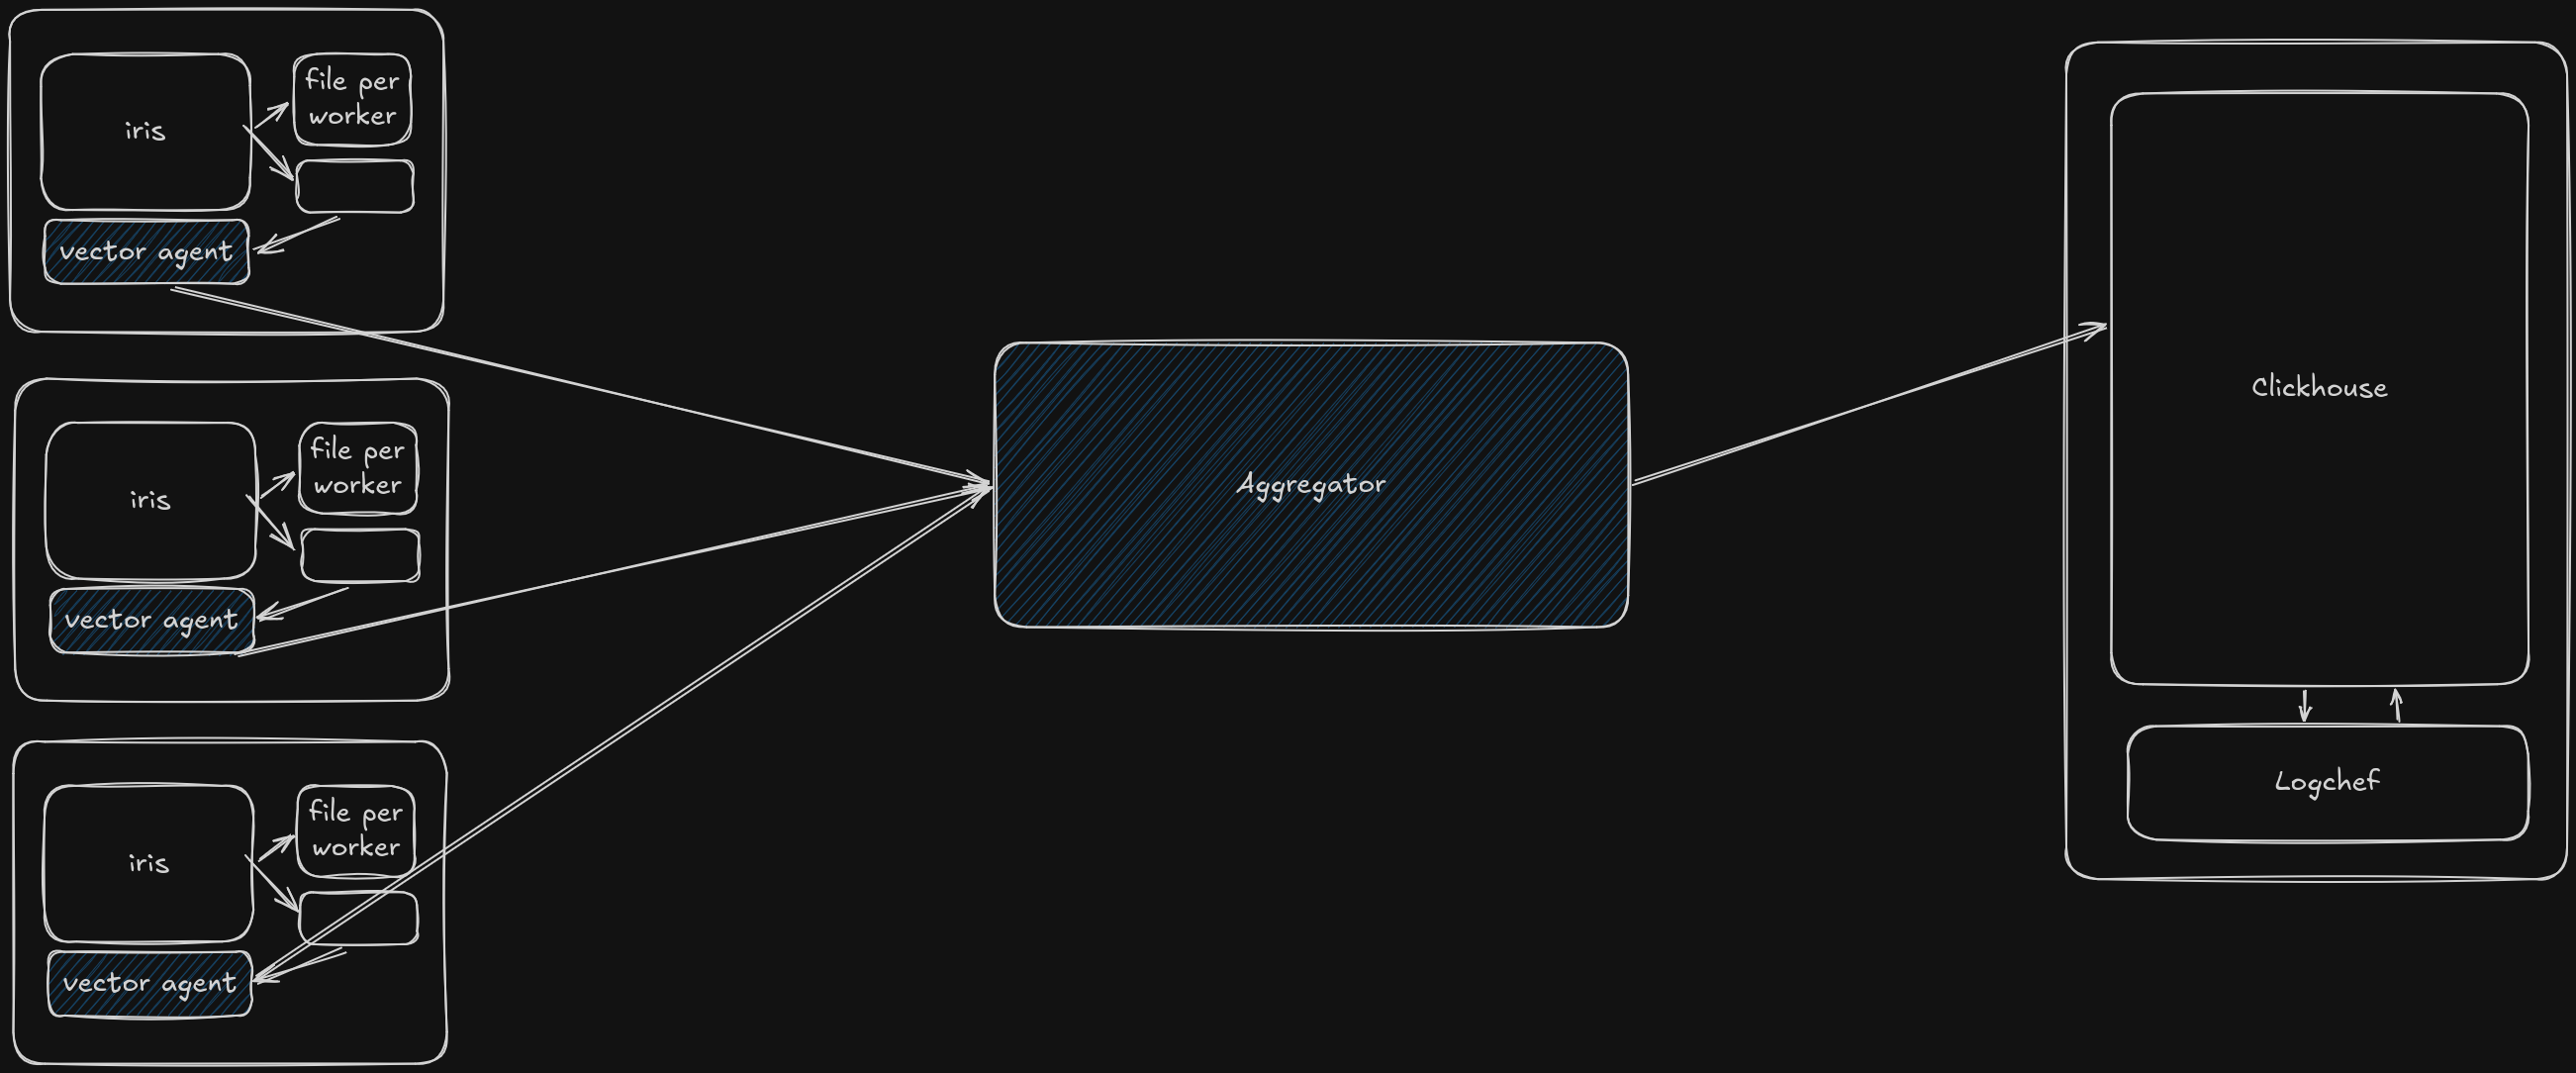
Here is how it all fits together in practice:
- Applications & Vector Agents: On each worker node, our application dumps log files per worker. A Vector Agent deployed in a sidecar model reads these local files and immediately forwards them downstream after converting log strings to JSON objects.
- Aggregator: All Vector agents ship their raw data to a centralized Vector Aggregator. This is where data from multiple nodes is buffered on disk, enriched with metadata (like node origin), and batched so we don’t spam our database.
- Storage & Visualization: The aggregator pushes batched data straight into ClickHouse for high-throughput ingestion. On top of ClickHouse sits Logchef, acting as our query engine and UI so we can easily search, tail, and analyze logs without touching raw SQL unless we want to.
What makes this architecture “Durable”?
Now, imagine we want to make this pipeline durable i.e., no logs should be lost. Well, there’s a solution to every problem:
-
At-Least-Once Delivery & Disk Buffering: If ClickHouse goes down or becomes temporarily unreachable, the Vector Aggregator doesn’t drop incoming logs. Instead, it writes incoming events to a persistent disk buffer (
buffer.type = "disk"). Once ClickHouse comes back online, Vector drains the buffer and resumes shipping. -
Backpressure Propagation: If the disk buffer fills up, Vector applies backpressure upstream (
when_full = "block"). This signals edge agents to hold onto local log files until the aggregator has capacity, ensuring data backs up safely at the source rather than being dropped in transit. -
End-to-End Acknowledgments: Vector agents do not consider a log line “delivered” until the downstream aggregator acknowledges it. If a network packet drops between an agent and the aggregator, the agent simply retries.
-
ClickHouse MergeTree Persistence: ClickHouse writes incoming log batches directly to disk using its columnar
MergeTreeengine. Unlike in-memory logging stores, once a batch write is acknowledged by ClickHouse, it is permanently written to disk.
Putting it all together
So a sample Vector worker config would look like this:
config: vector (worker)
sources:  logs:    type: file    include:      - /var/logs/iris/activity_*.log    read_from: end    fingerprint:      strategy: device_and_inode
transforms:  access_log_json:    type: remap    inputs:      - logs    source: |-      . = parse_json!(.message)      .time = parse_timestamp(.created_at, format: "%+") ?? now()
sinks:  aggregator:    type: vector    inputs:      - access_log_json    address: "$AGGREGATOR_ADDR"    acknowledgements:      enabled: true    buffer:      type: memory      max_events: 10000      when_full: block
config: vector (aggregator)
data_dir: /var/lib/vector
api:  enabled: true  address: 0.0.0.0:8686
sources:  from_worker:    type: vector    address: 0.0.0.0:6000
sinks:  ch:    type: clickhouse    inputs: [from_worker]    endpoint: "$CH_ENDPOINT"    auth:      strategy: basic      user: "$CH_USERNAME"      password: "$CH_PASSWORD"    database: logs    table: access_logs    format: json_each_row    compression: gzip    date_time_best_effort: true    skip_unknown_fields: true    acknowledgements:      enabled: true    batch:      max_events: 50000      timeout_secs: 5    buffer:      type: disk      max_size: 5368709120 #5 GB      when_full: block    request:      retry_max_duration_secs: 30
Now connect your CH instance to Logchef using a read-only user, and voilà: you have a production-ish logging pipeline ready.
Scaling above one instance
Though this is good enough for our use case, a few more improvements can be made especially for the aggregator.
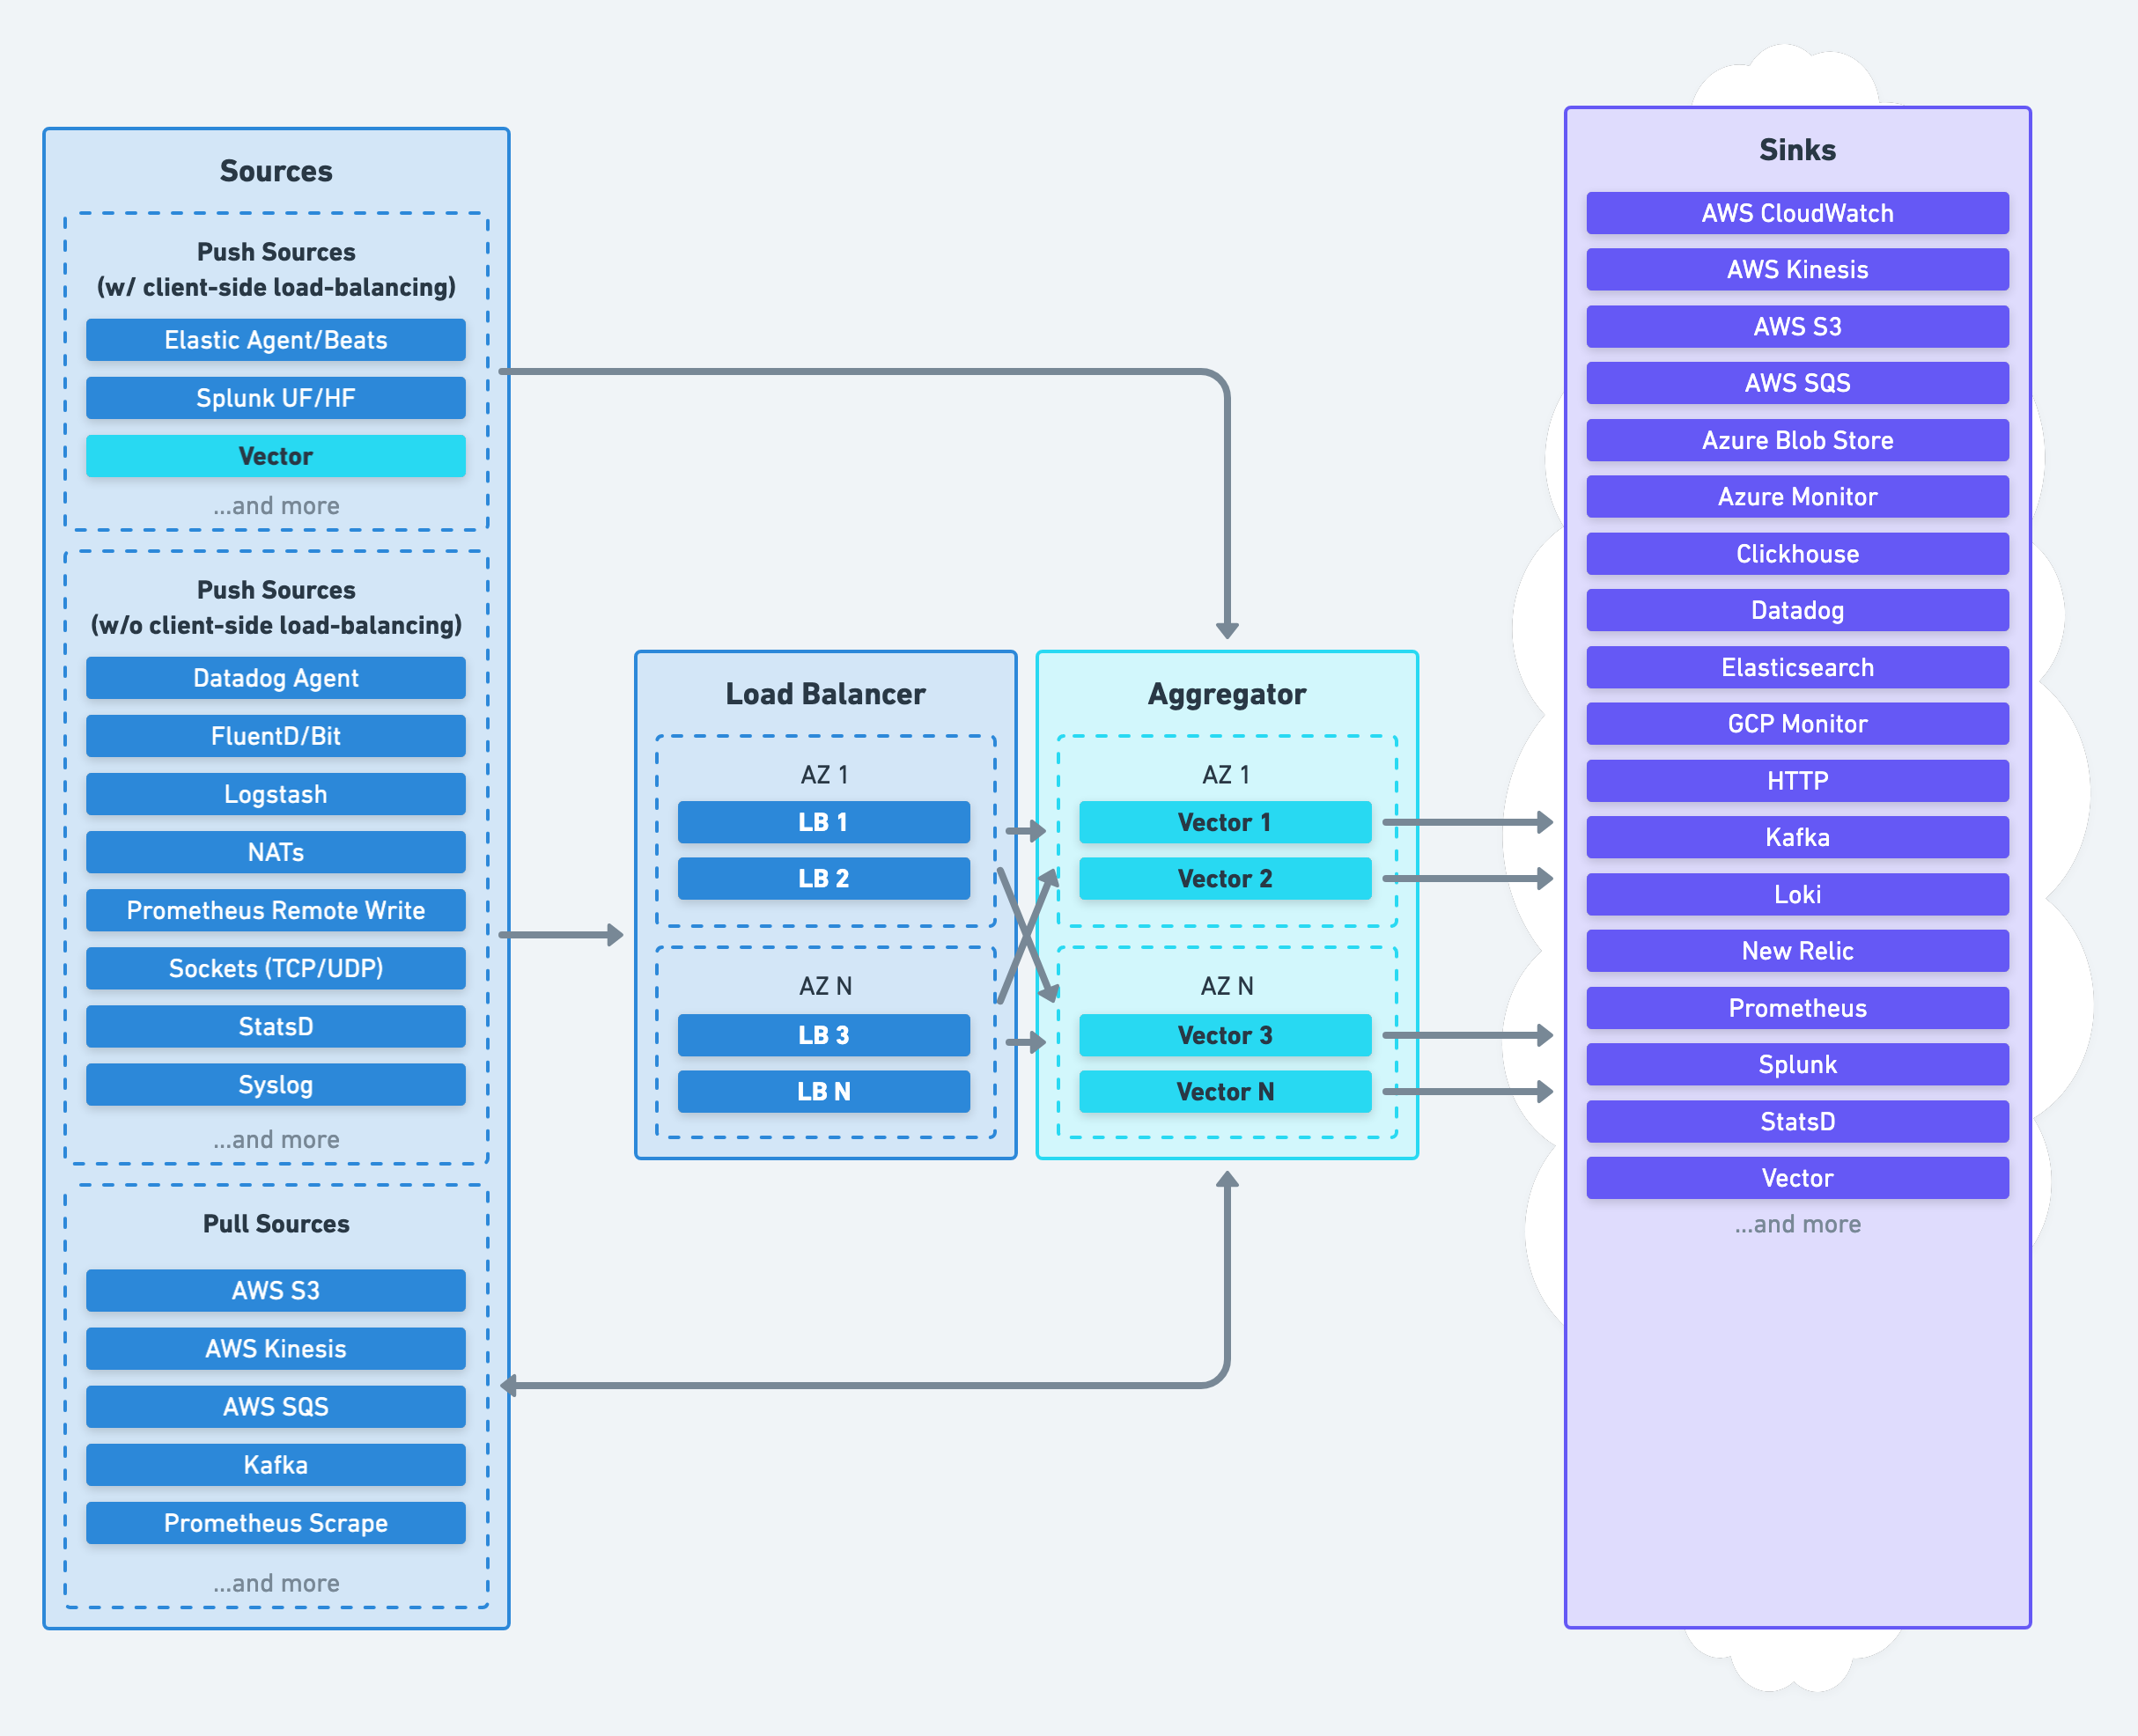
By placing multiple aggregators behind load balancers and scaling the CH instance, we can easily scale this pipeline significantly.